
The 2025 State of the City report shows marginal improvements more than cancelled out by some big drops. So what can be done to turn around the persistent malaise that grips the supercity?
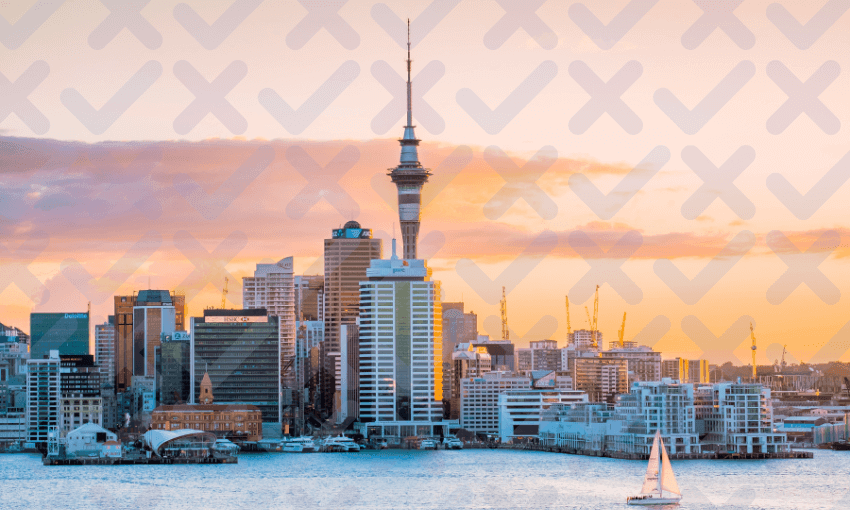
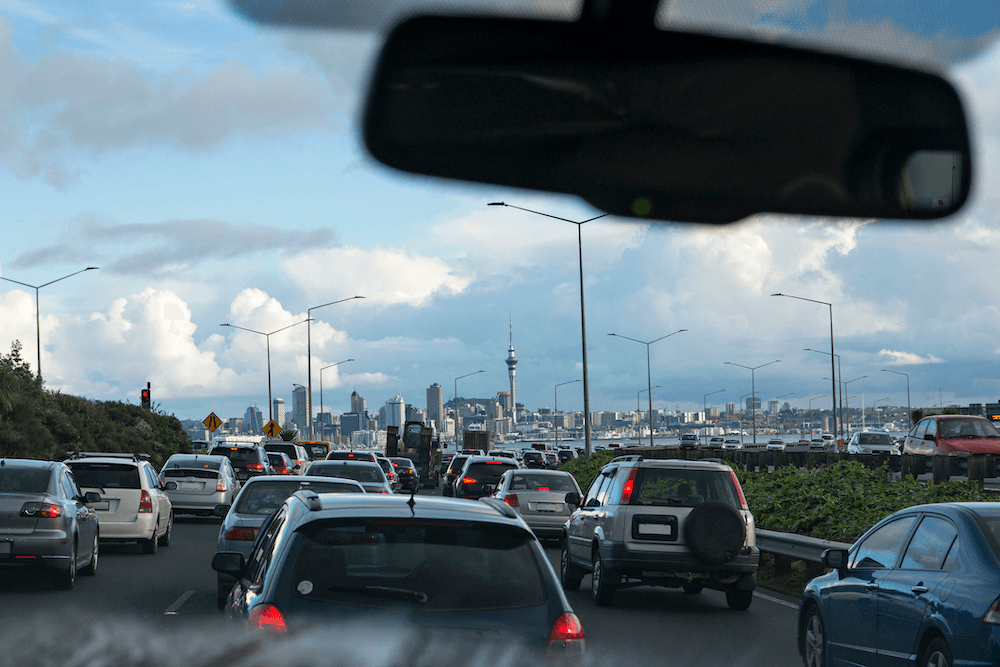
Mid-July is a tough time to be in Auckland. In summer the sea all around is calling you to be on it or in it, or at least looking at it. In July the water is mainly coming down on you, and you’re stuck indoors brooding on the city’s problems. So it’s the worst but also maybe the most honest time for the third annual “State of the City” report to be released.
It’s a review and ranking of Auckland against a group of peer cities, and the results are grim. The city is at a “turning point”, according to the report. Normally the expression would imply an arc towards some new exciting future. In fact, it implies that as bad as it is, it could get worse. “Weak economic performance, inadequate skills and innovation development, and disjointed and delayed planning are causing Auckland to lose ground, with the risk of falling further behind,” says Mark Thomas, the chair of Committee for Auckland, an independent organisation that funds and commissions the report.
It’s striking that the tone of the reports and the accompanying commentary has shifted from ambitious to almost plaintive. “The mission of cities to decarbonise and to heal deep social divides has also come much more into the spotlight,” read the 2023 edition. Just two years ago, and yet a different time. Later that year, Auckland swung pretty firmly to the right in the general election, which makes that Ardern-ish sentiment feel aspirational to the point of absurdity.
The 2025 report is notably more sober about the issues facing Tāmaki Makaurau. “The cyclical challenges facing New Zealand’s global city have been magnified… In 2025 we find that many measures still endorse Auckland as a top 10 city for balanced quality of life, and one of the world’s most open and diverse cities. But challenges persist and those with a stake in Auckland’s success need to work together to realise the promise the city has to offer current and future generations.” It’s a polite way of saying that across the three reports of 2023, 2024 and 2025, the city feels stagnant and decaying.
Is there any good news?
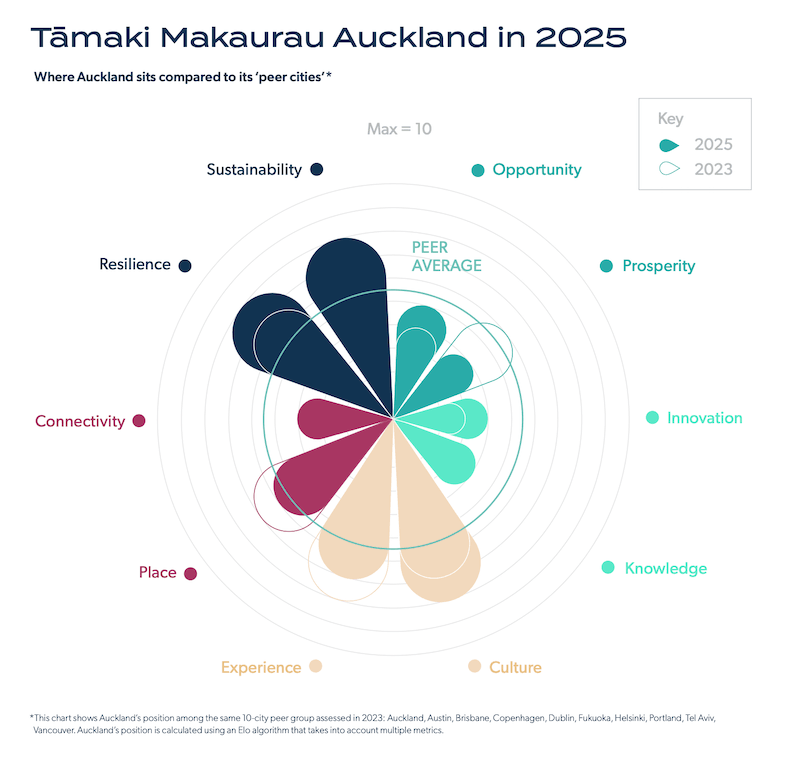
The report is compiled from “more than 140 global city benchmark and research studies, which together span more than 900 comparative metrics”. Those are then broken down into 10 areas, allowing us to be measured within a basket of 10 cities chosen due to:
- Reputation as one of the most liveable cities in their continent
- Smaller size and distance from global circuits
- Natural setting
- Climate uncertainties
- Drive to sustain success
Some of those markers seem a given – which cities aren’t trying to “sustain success” or suffering from “climate uncertainty”? – but in general the group feels well-chosen, at least in terms of what we would like to think of as our strengths. The other cities are Austin, Brisbane, Copenhagen, Dublin, Fukuoka, Helsinki, Portland, Tel Aviv and Vancouver. We’d like to think we belong in that group. Sometimes, reading this report, it’s hard to be convinced that we will for much longer.
There are some good points, though. Auckland has been assessed as improving across four of the pillars (culture, opportunity, resilience and innovation). Its improvement in resilience is described as in part through “ability to respond to shocks”. This can only be proved by testing, but while Auckland is still standing after Covid and the floods of early 2023, it’s hard to brag about resilience when the city still feels somewhat broken. Its cultural standing is put down to the quality of its architecture and dining, but points are deducted for the quality of its major events and sports.
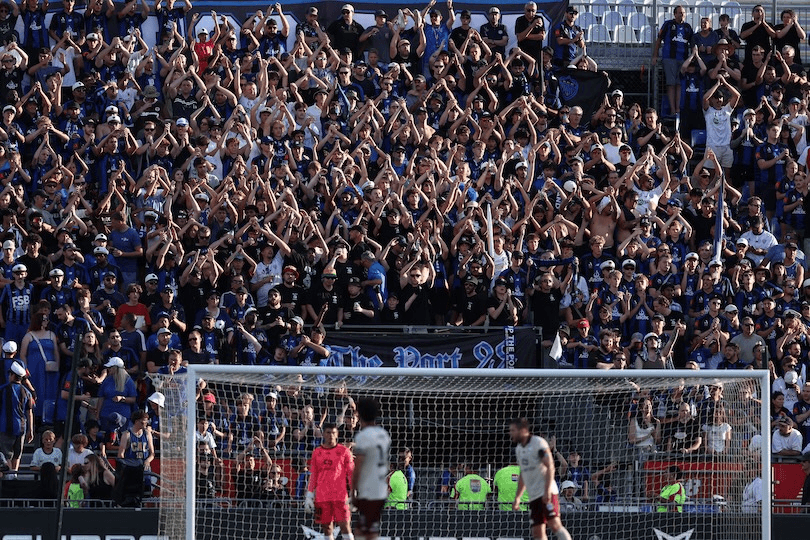
The latter is a bit of a blind spot for the report. Sport has been one of the few good news stories for the city, with both the Warriors’ sustained popularity and Auckland FC’s spectacular launch season evidence of a latent vitality which can erupt when properly channeled. Yet its major events issues are a compelling counterpoint: it is markedly falling off the map for many promoters, as artists increasingly perform mini-residencies in major cities and ask fans to travel to meet them. The implication is that Auckland is not a major city, nor New Zealand a major country.
Similarly, the praise for the film industry feels overblown – the sector endured a long and painful run which is not yet over. Likewise, part of Auckland’s culture score is attributed to its globally significant superdiversity. Which genuinely has made the city feel like few others – but the awkward truth is that its diversity is essentially a product of successive governments cranking the immigration tap, largely in response to young people leaving in droves.
Its improvement in innovation is attributed to growth in sophistication of its venture capital community, and its broader startup ecosystem. Which is good. But the critiques feel harsher than the praise. “Auckland has fewer firms in its start-up pipeline, and fewer exits, than most of its peers, [and] there is an order-of-magnitude difference in scale between Auckland’s current total enterprise value and the average of its competitors.” Tellingly, we rank equal last for “unicorns” – technology businesses valued at more than $1bn.
Where the city falls
It feels grimly instructive that Auckland’s wins are contestable and somewhat reliant on either external factors (storms) or unintended consequences (immigration). Our failures are much more directly attributable to poor policy and planning.
This feels most jarring when the achievements of other cities are rattled off. Copenhagen approved a new nine-station metro that will open up a reclaimed island. Tel Aviv commenced a three-ring congestion charging system which will raise $600m for public transport. Austin announced a huge Samsung innovation campus, backed by an $8bn government grant. And Dublin will in 2027 start construction on a driverless MetroLink that will halve commuting times across the city.
In Auckland, by comparison, we have talked a lot about a new stadium before picking the old one, weird location and all. We had a bold and privately funded bid for a new sports complex, before the process seemingly chased the money away. We announced light rail to the airport, before taking so long to break ground a new government could simply put a line through it. The two most profound pieces of transport infrastructure the city has commissioned this century (the CRL and the Waterview tunnel) were funded more than a decade ago.
This gets to the areas where the city is sliding backwards. They are place, experience and prosperity – a marked two-rung drop. Place is defined as “the overall desirability and coherence of a city as a mosaic of discrete and distinctive living environments”. Experience is what the city offers to its residents and visitors in terms of “interactions, engagements and encounters”. Prosperity means exactly what you think it means.
If these feel like more important pillars than some of the others, as well as things we can more control, that’s because they are. It gets to the maddening reality of Auckland as a city right now. For all its history, cultural diversity and incredible twin-harbour location, it is a city which feels stuck. Even when we get a win – a globally admired approach to upzoning for housing density, for example – we find a way to take an L, by failing to invest sufficient to really get a housing pipeline operating.
Who owns the bad grades?
The uncomfortable truth behind the report is that while some of these problems are Auckland’s alone, most of them are interlinked and have political authors. Building is costly and risky in part because of our planning laws and regulations. Operating many businesses is wildly expensive due to the eye-watering cost of power, which is in short supply in part due to those planning laws. Housing remains incredibly expensive, particularly for a low-wage economy, because: see above.
As a result, our young leave in droves, thinning the tax base from which to pay our relatively generous universal superannuation. Once mighty corporates like The Warehouse and Spark seem to be decaying before our eyes, in part because our talent works elsewhere. And the lack of bipartisan agreement on how to fix any of this holds back investment, which might improve productivity and create opportunities that keep younger people here, or bring them home.
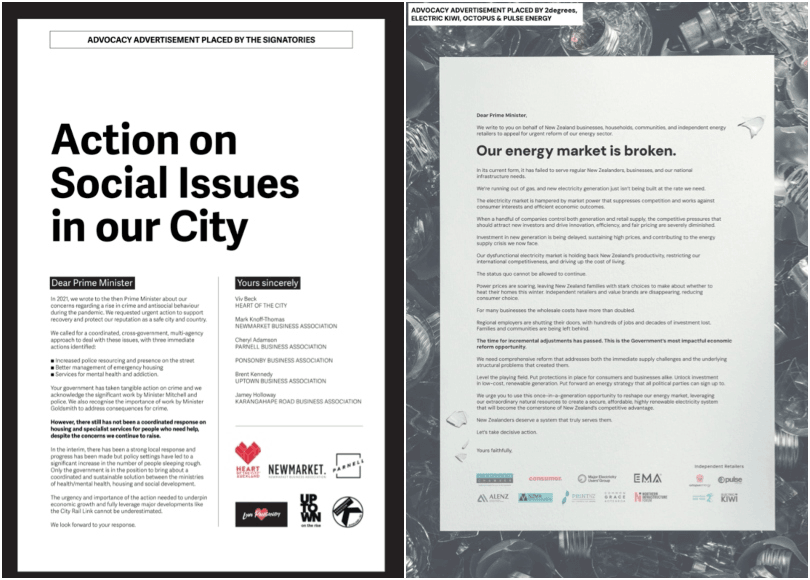
Over the weekend a group of inner-suburban business associations took a rare full page advocacy ad in the Weekend Herald, demanding “action on social issues in our city”. It decried the lack of progress on crime and rough sleeping in their neighbourhoods. The inner city has been a construction site for years, with high retail vacancies, persistent hospitality closures, the rise of work-from-home culture and inadequate transport all combining into a powerful repellent force. The following day, a group of business leaders published an open letter calling for urgent action to fix a “broken” energy sector.
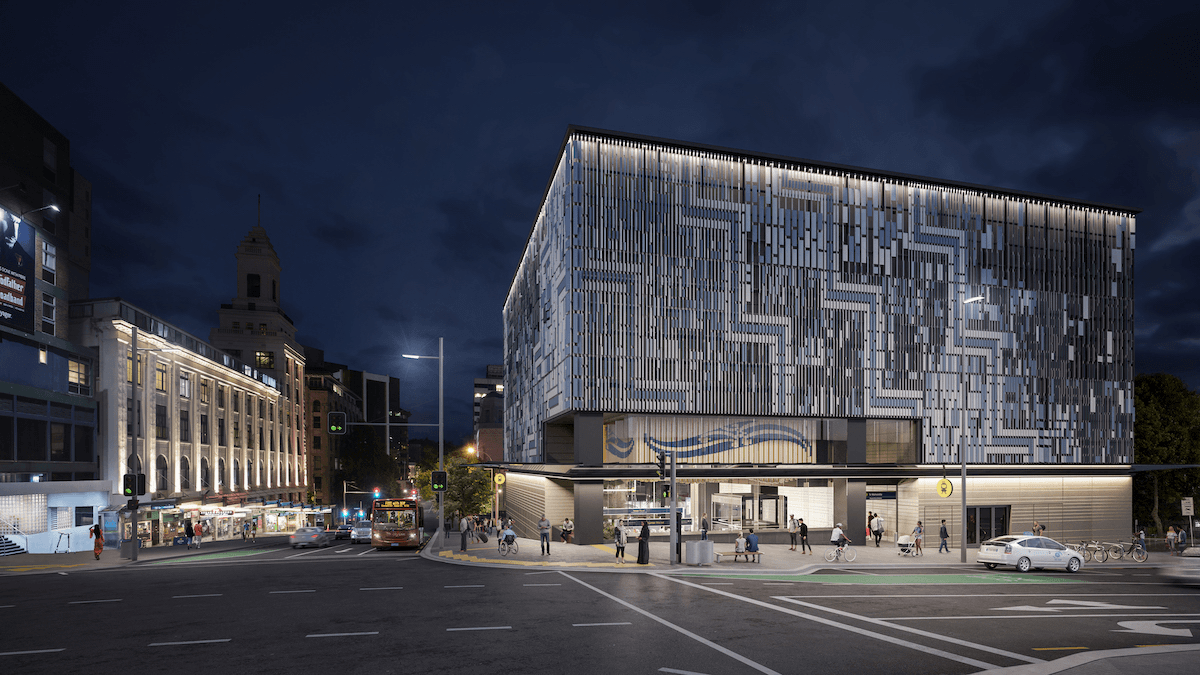
It feels symptomatic of a sense of polycrisis throughout the city. It means an excess of hope is pinned to the City Rail Link and, to a lesser extent, the SkyCity Convention Centre, both due to open next year. They remain the city’s most plausible hope at turning around the persistent malaise this report highlights. However they are also the result of decisions made years ago. What matters now is what comes next. On that the report is stark in its conclusions. We have great human potential and natural features. But without meaningful political change we will continue to squander both.