

The price of kumara has soared in the past two years, so maybe it’s better to buy spuds? Data scientist Aaron Schiff was tired of trying to figure out how to get the best deals, so he built an app.
At the supermarket (toddler in tow) I find it very hard to remember grocery prices, especially seasonal items or things I don’t buy regularly – and I always have a sneaking feeling that I’m buying unnecessarily expensive stuff.
So I made a simple web app that shows freely available data on the average prices of basic food items in New Zealand. As an economist, I also hope that if people are better informed about prices, shops will find it harder to charge excessively high prices for things.
There are two interesting questions about the price of a grocery item: how has the price trended over time, and how does the price vary with the seasons around that trend? The first question tells you which products are becoming more expensive or cheaper over time, and the second question tells you when in the year is the best time to buy. Unless you collect regular data on prices over time, it’s not possible to answer these questions and make smarter shopping choices.
Fortunately, Statistics New Zealand collects and publishes monthly data on prices of many basic food items as part of its monitoring of overall inflation. Unfortunately, the data is buried in a cantankerous website called Infoshare.
There are some caveats on this data; the prices reported for food items are averages across retail outlets, and sometimes only include the cheapest product in a given category. Stats NZ say they haven’t attempted to match the prices they collect to the actual products, places, and times that people bought groceries, so the average prices they report might not reflect the average prices people paid.
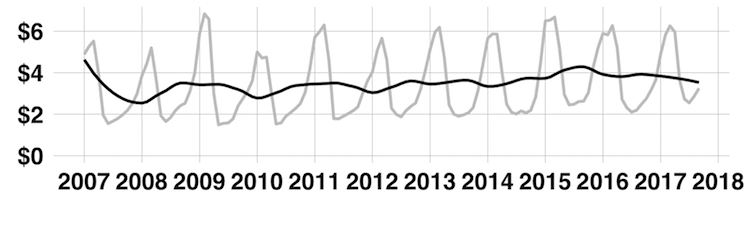
But I figured the Stats NZ data is better than nothing, and at least it will give you a sense of whether $4/kg is a reasonable price for kiwifruit right now (probably not – kiwifruit was around $2.74/kg this time last year). So what is the cost for kiwifruit doing over time? It turns out that over the long term kiwifruit prices have been pretty stable:
Average kiwifruit prices per kg
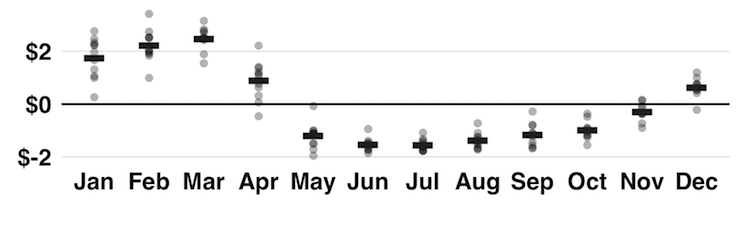
While the monthly variation of kiwifruit prices around that trend fluctuates by up to $2/kg above and $2/kg below, so you can expect to pay about $4/kg more for kiwifruit in March than you will in June or July:
Variation of kiwifruit prices around the trend (per kg)
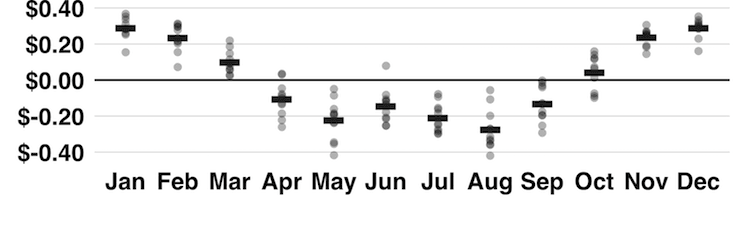
You can also learn that canned soup is a little bit cheaper in winter than in summer, probably due to pricing promotions:
Variation of canned soup prices around the trend (per 500g can)
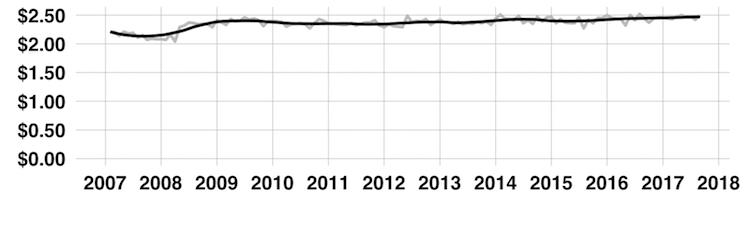
And that the price of a bottle of soy sauce has hardly changed in the past ten years:
Average soy sauce price (per 300 ml bottle)
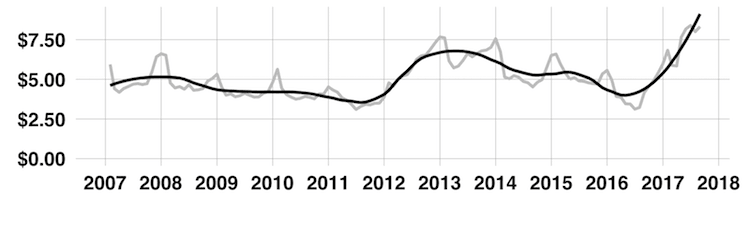
While the price of kumara has soared in the past two years:
Average kumara price (per kg)
To make developing this kind of application easier, organisations like Statistics NZ that publish data need to improve the way that they describe it. For example, it wasn’t clear what was included in some vague-sounding items like “Fresh fish, 1kg”, so I decided to exclude those.
The prices of some other items like avocados and broccoli are presented per kilogram rather than per item as they are usually sold, making it hard to compare the published data with actual prices (I’m waiting to hear back from Stats if they can help me to convert the data to per-unit prices). And it wasn’t immediately clear whether the published prices include GST or not (they do, but I had to hunt around to find out).
These problems are probably because the data is collected for the purpose of tracking overall inflation, and not a lot of thought has gone into how to make it useful for other purposes like informing shoppers. Stepping back a bit, open data can be incredibly useful and powerful, even for something as mundane as buying the groceries. But for such uses to be developed, simply making the data available is not enough. It also needs to be described and documented clearly.
Aaron Schiff is a freelance data scientist and economist. He also serves as Data Counsel for Figure NZ.
![]() The Spinoff’s business content is brought to you by our friends at Kiwibank. Kiwibank backs small to medium businesses, social enterprises and Kiwis who innovate to make good things happen.Check out how Kiwibank can help your business take the next step.
The Spinoff’s business content is brought to you by our friends at Kiwibank. Kiwibank backs small to medium businesses, social enterprises and Kiwis who innovate to make good things happen.Check out how Kiwibank can help your business take the next step.