

As the countless graphs of Covid-19 cases have shown us, what comes up must invariably come down. Justin Connolly asks if we need to think that way about the economy.
There have been many funny posts circulating on social media about life in Covid-19 lockdown. One in particular caught my eye because it was funny, and it also has a serious message well beyond the Covid-19 pandemic. It tells us a lot about our economy.
It was a graph with January, February and March on the horizontal axis and “time spent looking at exponential graphs” on the vertical axis.
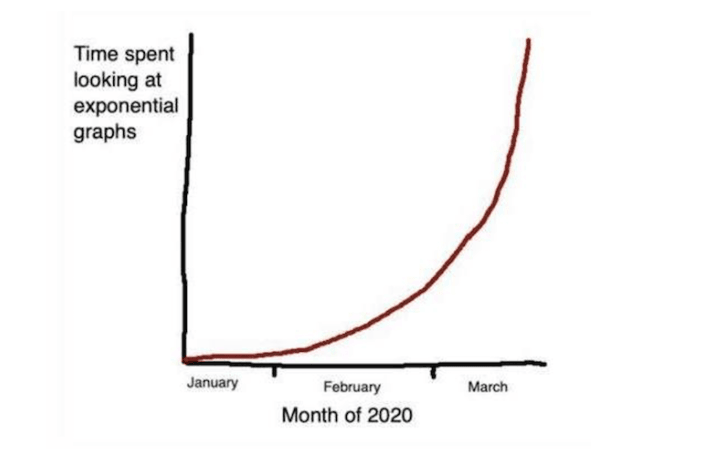
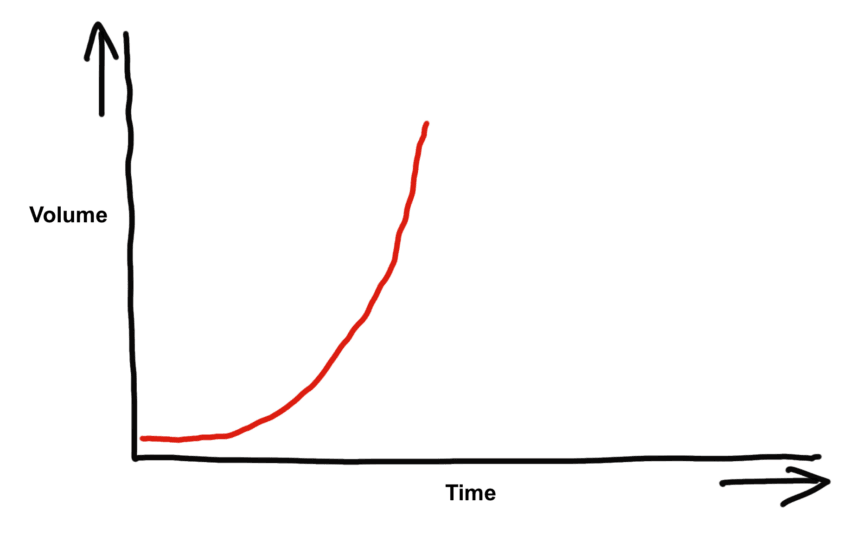
It was a simple visual joke – the use of an exponential graph to demonstrate how much exponential graphs have become part of our daily dialogue. But it also tells us a lot about our economy. Exponential growth curves have that distinct shape. If you didn’t know that before Covid-19, you do now. Growth slowly accelerates until it seems to skyrocket. There are two important things to know about exponential growth. Firstly, it comes from a consistent growth rate and secondly, it can’t go on forever.
By definition, exponential growth is a doubling in absolute terms of whatever you are measuring, over a consistent and repeating period of time (the doubling time). While the graphs appear to grow like crazy, what many people don’t realise is that such growth comes from a consistent growth rate. It seems counterintuitive, but a consistent or static growth rate always results in exponential growth.
With a 3% growth rate whatever you have will double every 23.3 units of time, for 5% it will double every 14, for 7% every 10 units.
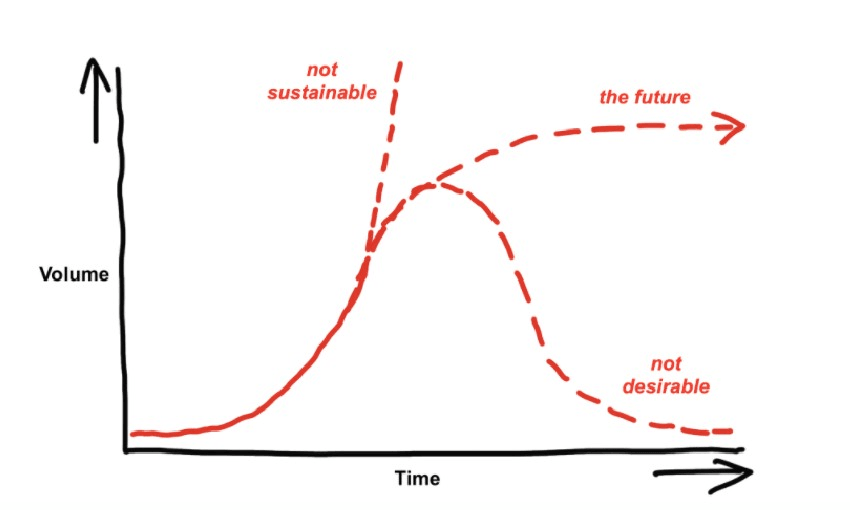
Now let’s consider the second point: exponential growth can’t go on forever. The laws of physics don’t allow it. If you carry on your graph for long enough the shape will always change after the exponential part.
The important question is, what do we want our graphs to do after the exponential part?
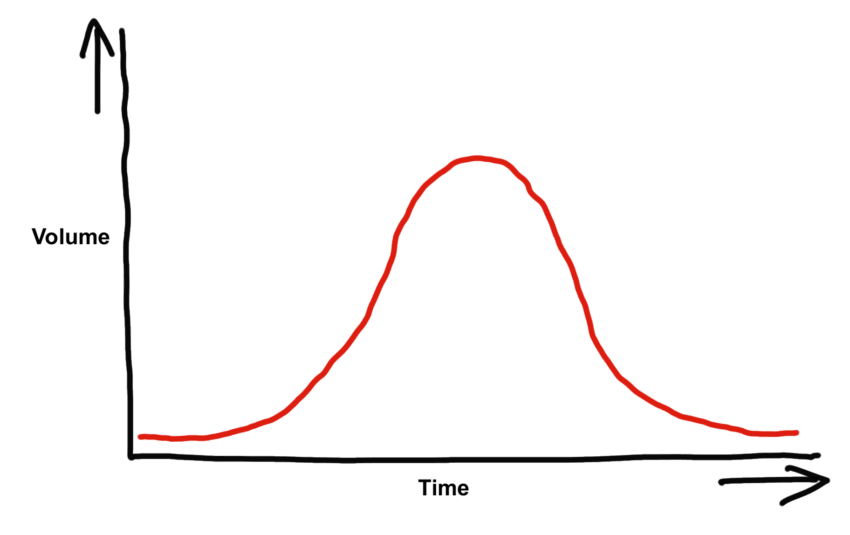
In a pandemic we obviously want infections to decline. Growth eventually slows, levels off, then declines, not because the infectiousness of the disease is reduced but because it either ran out of new people to infect or it was successfully contained or managed. Or both. We’re seeing this in some parts of the world now.
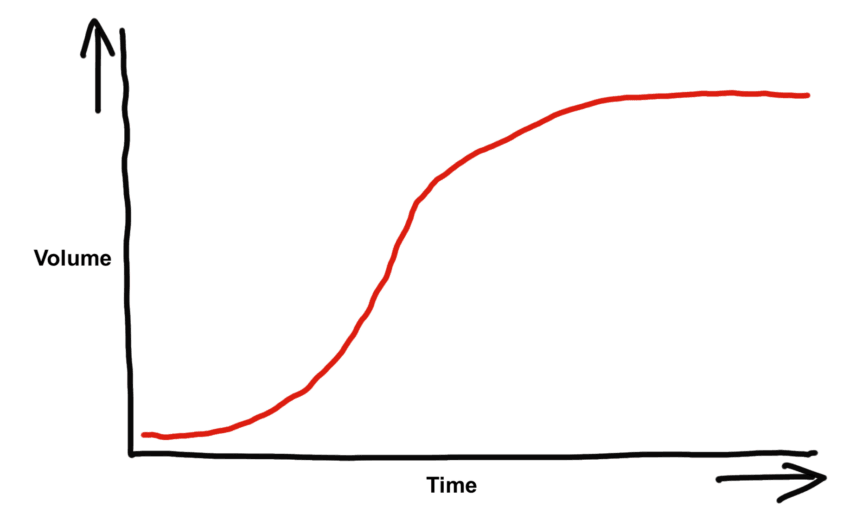
Exponential growth is all around us in nature too and it’s not necessarily bad. For example, plants grow exponentially at first then level off as they reach maturity or the limit of their nutrients or space. Here, we expect our graphs to plateau and maintain an equilibrium.
Now let’s take that big leap – what’s the link here with the economy?
Since around Would War II, the main way we judge economies as “successful” is by how much they grow. If GDP increased then you were winning. If your GDP grew the most, then you were a winner among winners. A growth in GDP has become shorthand for economic success.
But is it? GDP simply measures how big an economy is, not whether it is actually delivering what we need it to.
Life expectancy in New Zealand is around 80 years. If we averaged 3% economic growth throughout my life, the economy would have doubled by my 23rd birthday (it didn’t quite, but wasn’t far off). By my 47th birthday, it will have doubled again to be four times larger than my birth year. By my 70th birthday, it will have doubled again to be eight times larger. For children born the year I turn 70, the economy would be 64 times larger than it was when I was born. By the time those children turn 70 I’ll be long gone by then, but therein lies the problem. With Covid-19 we see this growth happening in days or weeks. With the economy it takes years and we don’t see it. But the same exponential pattern is occurring.
While GDP is just a number, it represents all the activity in the economy. We produce things that are reliant on our precious resources but that production can come at a cost to our environment and our wellbeing. Even if we use resources more efficiently and pollute less, our production grows and the pressure on our resources actually increases because our focus is on growth.
So that question again – what do want the graph of our economy to look in the future? We know it’s not physically possible to sustain exponential growth, and we don’t want it to crash back down like a pandemic. So we want it to plateau yet still continue to provide for our needs. How do we do that?
Well, it’s not going to be easy. But thankfully, a lot of folk are already thinking about how to transition to an economy of the future. Fundamentally, this is what discussions around “wellbeing” are about – how do we provide for, and measure, our collective wellbeing other than through GDP growth?
Last year the New Zealand government produced its first wellbeing budget (linked with Treasury’s Living Standards Framework) with this in mind. Groups like the Wellbeing Economy Alliance and the Post-Growth Institute are actively contributing to this conversation and circular economy is a term that is becoming more mainstream. Kate Raworth’s excellent book Doughnut Economics discusses what future economies need to look like so there are tools available to us.
It won’t be an easy journey, but it might be a necessary one, and like all journeys it begins with a first step. That step is to recognise that growth is not the measure of economic success we need for the future. Now is the time for us to take that step. Wouldn’t that be a powerful result from a visual joke on the internet?
Justin Connolly is the director of Deliberate, an Auckland-based specialist consultancy.