


If you data nerds thought the census was fun, wait until you get a load of this. Alex Braae picks out some of the most interesting data points from the 2017 NZ Election Study, released yesterday.
They say there’s only one poll that matters – the one that takes place on election day. They’re wrong.
The other poll that matters is a survey conducted every three years, called the NZ Election Study, conducted by a collection of this country’s leading political scientists. It goes deep into how we as a country feel not only about specific parties and whether we’ll vote for them, but into more esoteric ideas around how we feel about politics as a whole.
What comes out of it is an absolute treasure trove of detail and data, all presented in a raw form that feels almost totally unchanged from the first one in 1990. For anyone hoping to deepen their understanding of politics in this country, digesting it is a must.
But who has time for that? Instead, here’s eight buzzy details that jump out from it. Note – percentages have been used as they appear in the survey (rounded to the nearest whole number) but bear in mind that there is a margin of error attached to them.
1. Minor parties make more people absolutely furious
One of the opening questions asks respondents to give each party a rating for how much they like or dislike them – 0 being strongly dislike, 10 being strongly like. The dislike responses to Labour and National are relatively benign – only 11% of respondents gave Labour one of the three most negative rankings, and only 18% said the same for National.
But looking at the minors, a very different picture emerges. For the Greens, it was up to 21%. For NZ First it was 26%. The Opportunities Party was up to 30%. For ACT, it was more than a third of all respondents, with 37%. The Mana Party got 39% steamed up to that degree. It probably reflects the less compromising place minor parties have in our system – to carve out a distinct identity, they actually do need to piss a few people off in the process.
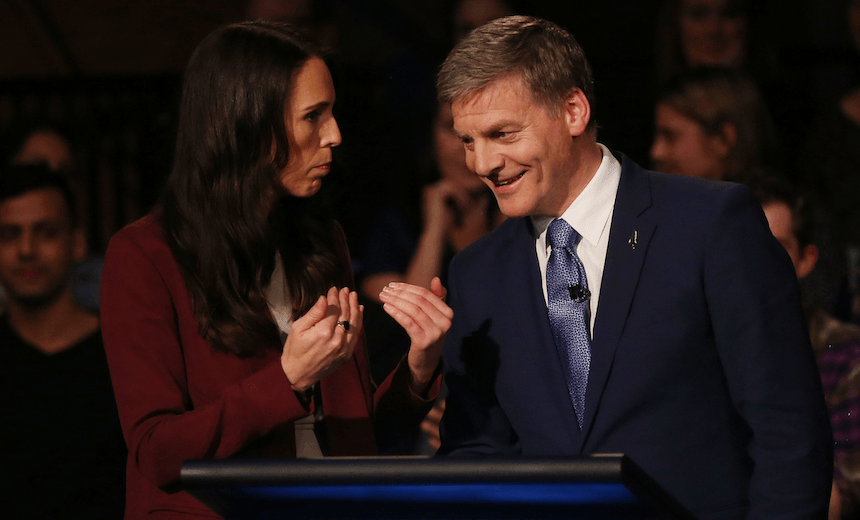
2. Bill vs Jacinda was about competence vs trustworthiness
Remember Bill English? Used to work with John Key, filled in for a bit at the end. Well, if elections were won purely on preferred PM (in this survey only) then he would have actually stayed on. The percentage of respondents who most wanted him to be PM was 44%, compared to 39% for Jacinda Ardern. Interestingly, that’s pretty much bang on what National’s party vote percentage was in 2017, while Labour’s party vote was a few points lower than what Ardern scored in this survey.
Going down into the weeds of it all though, 77% of respondents said they very much or fairly well agreed with the idea that English was a competent leader; 67% said the same about Ardern. But she was rated quite a bit more trustworthy, with a full third of the survey giving the strongest possible endorsement of her trustworthiness.
3. The Greens are seen as overwhelmingly left wing
On a 0-10 scale (0 being left-wing, 10 being right) more than half of those surveyed put the party in one of the four most left wing slots, roughly evenly split between all four. Just under 10% put the party in the centre, and there was a cumulative 4% or so putting it anywhere to the right of that.
In terms of other parties, people saw them roughly how you’d expect: Labour congregated around the centre-left, National around the centre-right. The big number that jumps out – more than a quarter of those surveyed saw NZ First smack bang in the middle. A quick grain of salt about these categories – for the minor parties in particular, up to half of respondents didn’t necessarily know where they should be putting parties on the scale.
4. We voted on the economy, housing and health
People were asked to rank their top three issues, and these three placed in the top three positions for each of the three subsequent lists. Which is a roundabout way of saying, this is basically what mattered to the voters. Interestingly, neither the environment nor law and order really rated as top issues – but when respondents were asked if more money should be spent in either area, there were significant majorities saying yes, more should be spent there.
5. We love children and the elderly, but god help you if you’re unemployed
This is one of those fascinating and uncomfortable areas in the NZ political psyche – who is ‘deserving’ of help. When the question “should government provide decent living standards” was asked about the elderly and children, a full 90% and 89% said they should or definitely should respectively. But that drops to just 58% for the unemployed. And only 60% of people reckon the government should provide a job for everyone who wants one.
And we’re flinty as hell towards beneficiaries who break the rules – 60% of respondents said claiming welfare benefits to which you’re not entitled can absolutely never be justified – the top slot on a ten-rank scale. The next three highest proportion of respondents all leaned towards the less forgiving end too. Incidentally, the negative responses there were somewhat stronger than the answers to a whole lot of other questions around dishonesty, such as justifying dodgy expense claims and tax evasion. The least forgivable action was taking a bribe at work. However, we’re overall pretty chill about avoiding public transport fares, or paying someone cash knowing they’ll evade tax with it.
6. Some would like to vote online, but it wouldn’t make a huge difference to voting intentions
Just over a third of respondents said they’d have preferred to vote online, compared to just over half who said they’d have preferred a polling station. However, when asked if it would have affected their decision to vote, 68% said online voting wouldn’t have made them any more or less likely to cast a ballot. Respondents were roughly evenly split on whether they have confidence in the privacy and security of online voting.
7. Confidence in the previous government was fairly high
Only 14% of respondents said the last government (the Key/English one) did a very good job. But a full 54% of respondents said the government had done a fairly good job over the last 3 years. Less than one in ten people thought it had done a very bad job.
8. And finally, we’re a nation of slacktivists
Just 3% of us made a submission to a select committee in the past five years; 9% have taken part in a government consultation. Just under 10% have gone on some form of march or demonstration, 4% have phoned talkback, and 5% have written to a newspaper.
But those numbers jump heaps when you look at a different, more gentle form of political activism. 27% have made a consumer choice for political or ethical reasons in the last five years. 23% have done social media posts about a political issue. And a whopping 36% of respondents have signed a hard copy of a petition in that same space of time.
We’re not apolitical, we just don’t go out of our way to do politics. And yet by the same token, four out of five people believe it is a citizen’s duty to vote.