


The usual way electoral results maps are presented can be deceiving, over-emphasising large but sparsely populated rural areas and under-emphasising densely populated ones. Here’s another way to make sense of 2020’s election results.
This post was updated on 16 November 2020 to reflect the final vote share.
In 2017, I debuted the hexamap: a way to present the election results by making each electorate the same size. This reflects the equal political power of each electorate, and lets us display the political balance of the country more accurately. I’ve broken down the candidate and party votes, below.
The Geographic Electorate Map
Why bother with this? While the geographic map is important for showing who won where, it can be misleading. Looking at the electorate results for example, the vast rural electorates are visually emphasized, and the densely-populated urban areas are obscured. They all contain the same amount of people and influence. Yet all 31 Auckland, Wellington, and Christchurch electorates can comfortably fit into Southland or West Coast-Tasman.

The Electorate Hexamap
Instead, we can turn the 72 electorates into a ‘hexamap:’ displaying each electorate as five equally-sized hexagons. (This is one more electorate than in 2017, as the North Island’s population grew by enough to get an additional seat; Takanini, in South Auckland).
The Electorate Hexamap lets us get a better sense of proportions. It retains the general shape of the country, and tries to keep each electorate in a similar position relative to its neighbours.
I’ve labelled the electorates that have medium-sized cities and a few of the Auckland electorates. This helps to identify the other electorates, despite their resizing and shuffling around. For example, expanding Auckland (due to its large population) pushes Hamilton further south, and Tauranga west; and the sprawling West Coast-Tasman shrinks to the corner of the South Island.

Electorate Hexamap – Candidate Vote
We can colour the hexamap to show the winners in each electorate. Whomever gets the most candidate votes wins the seat, and the major two parties dominate: only three seats were won by minor parties (one each by Greens, ACT, and the Māori Party), with two of these by a less than a 5% margin. In total, 46% of candidates (35 out of 72) won with a majority (ie, more than 50%).
Compared to election night, the special votes pushed Labour candidates ahead of National incumbents in Northland and Whangārei in the North, and Maungakiekie in Auckland.


Electorate Hexamap – Party Vote (Relative Lean)
The best use of the hexamp is illustrating the political balance of the country. We compare the combined votes of government parties (Labour, Greens, and New Zealand First), and opposition parties (National, ACT, and the Māori Party), to the country as a whole.
The lean of the electorates is very similar to 2017; the:
- 20 rural electorates (30% of the vote) lean 8% to the right;
- 7 Māori seats (6% of the vote) lean 17% to the left;
- 31 major urban electorates (43% of the vote) lean 3% to the left; and
- 14 city electorates (21% of the vote) are closely balanced, leaning 1% to the right.

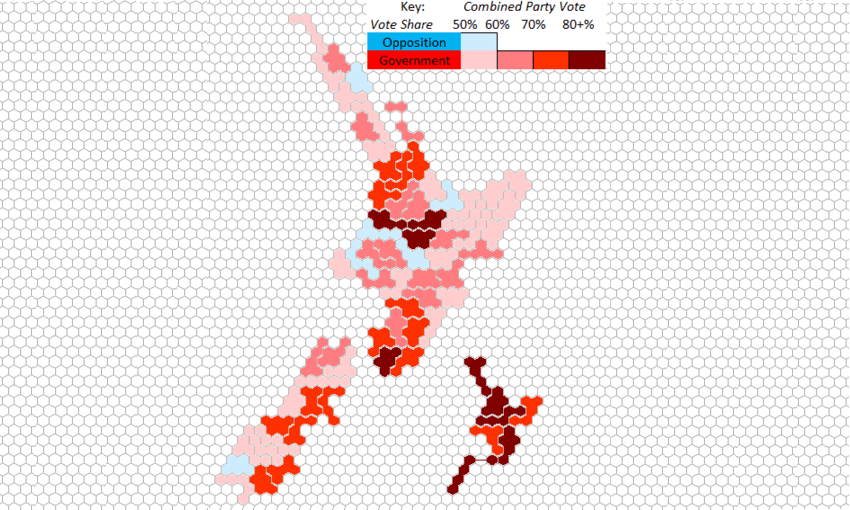
Electorate Hexamap – Party Vote (Total Vote)
Whereas the government received 52.1% of the vote in 2017, versus 47.9% to the opposition; in 2020, the government received 63.8% (though New Zealand First did not make it back into Parliament, failing to clear the 5% threshold), and the opposition received just 36.2%.
This allowed government parties to collectively win more votes in many electorates that typically lean against them. For example, Epsom, which voted 13.6% to the right of the nation, narrowly voted for the government – 50.2% to 49.8% for the opposition. Indeed, the opposition only won more of the vote in 6 out of 72 electorates.
On election night, National-Act-Māori outpolled Labour-Greens-NZ First in 10 electorates. But in the final tally, special votes flipped 4 of them to the government: East Coast Bays, Epsom, Pakuranga, and Papakura.

