


Everyone in politics is talking about rogue polls, after a Newshub Reid Research survey put the National Party on just 25%. Statistician and University of Auckland professor Thomas Lumley explains whether we can see this as one of them.
“Even with the most rigorous methodology, one in 20 polls will always be a rogue and this is clearly one of them.” – Gerry Brownlee
The deputy leader of the National Party is correct that focussing on a single poll result is a bad idea, because the uncertainty in individual poll results is quite large. But it’s not helpful to confuse the usual sampling variation in opinion polls with the idea that some polls are just wrong.
In a mathematically perfect world, given a very large number of opinion polls each sampling 1000 people, 19 out of 20 will get within 3% of the true support for a major party, and one out of 20 won’t, with the one out of 20 typically being off by just a little more than 3%. Here’s a picture of 60 computer-simulated polls of a party with 30% true support. Each line is a poll, with the dot being the headline support estimate and the line being the uncertainty interval. The line is grey if the poll was within 3% of the truth, and red if it wasn’t.
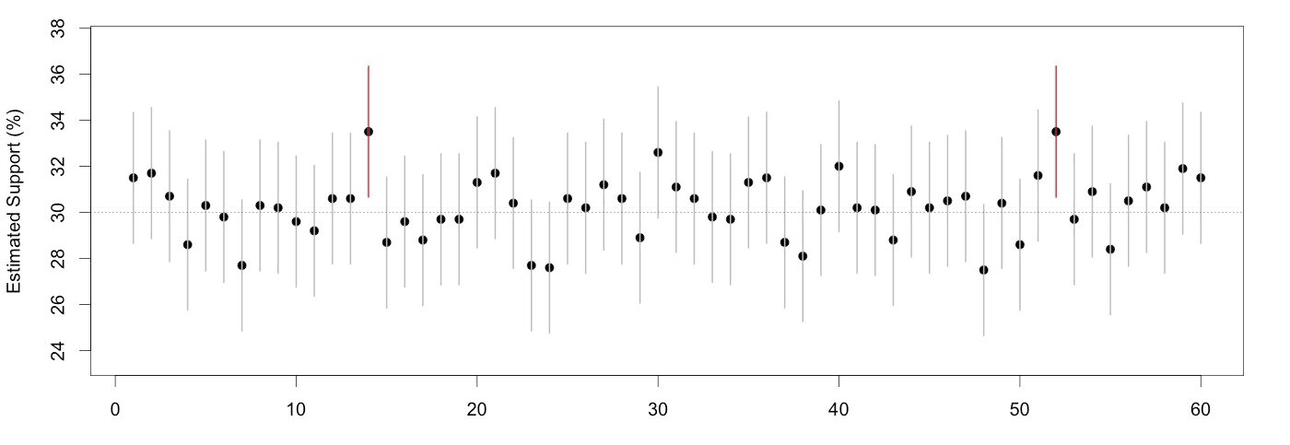
Out of 60 polls, two were red – about the one in 20 you would expect. But these aren’t rogue polls. The largest sampling error was 3.5%; bigger than 3%, but only by a little.
Real polls are more complicated than this and they show more variation. Real polls don’t have the same chance of sampling everyone in the population. Some people aren’t home; some are busy; some just don’t like polls. Real polls use weighting or quota sampling to try to correct for the unequal sampling, and they remove the bias pretty well, but there’s a cost in increased uncertainty.
Worldwide experience is that opinion polls differ a bit more from each other than they would in a mathematical utopia. Rather than being within 3% of the truth, it might be a better approximation to say that 19 out of 20 would be within 4-4.5% of the truth. Here’s the same set of computer-simulated polls, rescaled to allow for the additional variability. Again, a red line means the result is off by more than 3%.
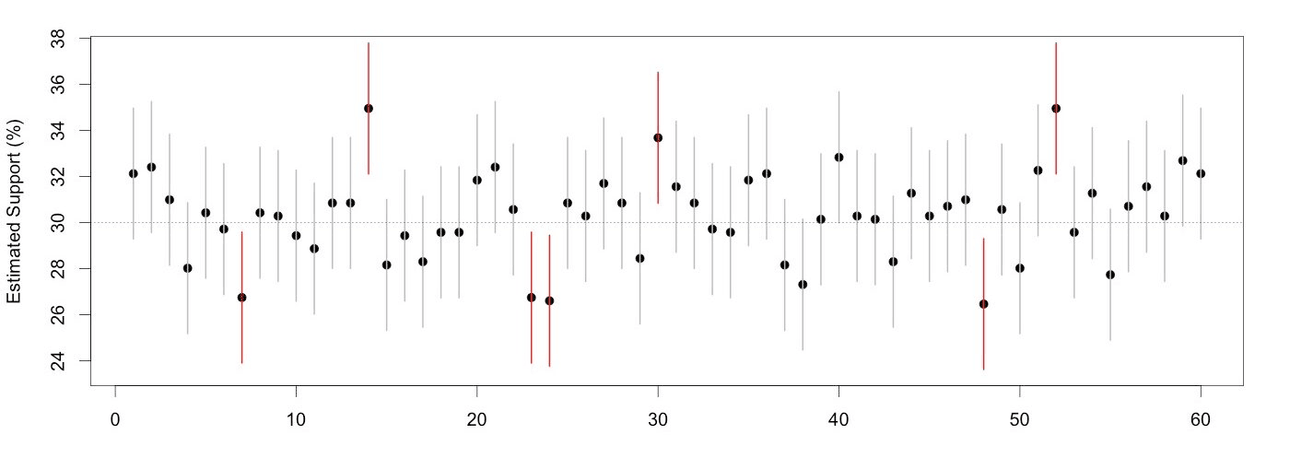
Now, out of 60 polls, seven were red. The worst poll was off by nearly 5%. You wouldn’t want to rely too heavily on a single poll with this level of accuracy, but it would be unreasonable to call any of them ‘rogue’.
Sometimes, though, you get a poll that just seems to be wrong – it’s inconsistent with previous polling, and there isn’t any good reason to think the true level of support has changed. The idea of a ‘rogue poll’ is that you’re seeing something different from the slight excess deviation that is expected in one poll out of 20, and that you would be better off ignoring it, rather than incorporating it into your mental accounting of the election prospects. In the 1970s and 1980s there was lot of statistical research into ‘robust statistics’; automated ways of handling outlying (or ‘rogue’) observations that are more wrong than a simple mathematical model would expect.
Here’s a plot of all the published NZ polling results this year, with two trend lines. The blue line is a standard robust smoother (called lowess), which will try to ignore rogue points; the black line is the same smoother with the robustness turned off.
It’s clear that something unusual has happened in the past few polls. The last three can’t be reconciled as estimates of a constant level of true support with the usual accuracy. This is the sort of setting where ‘rogue poll’ might make sense as a description.
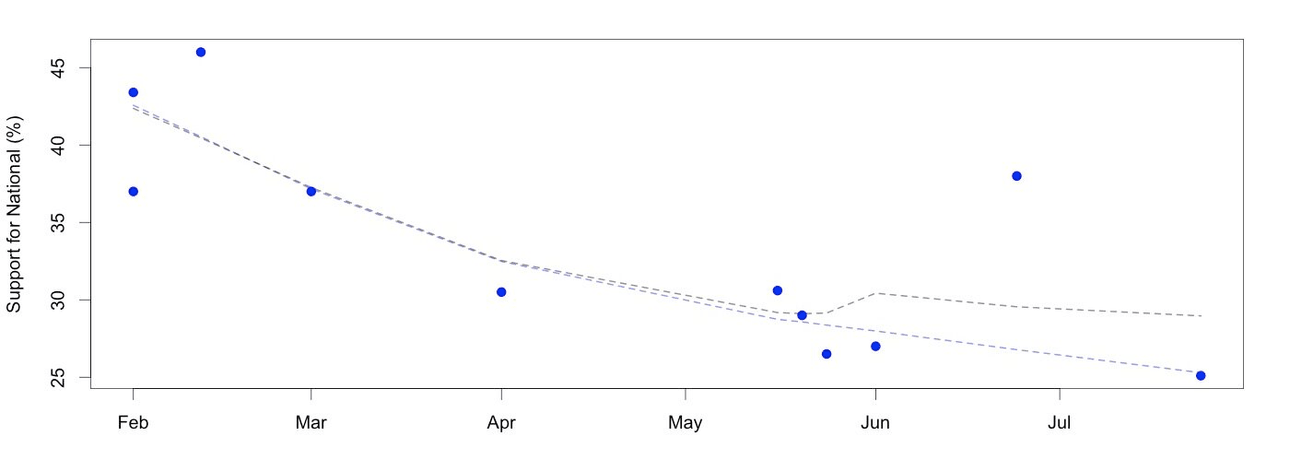
Statistically, the 38% in late June looks like the outlier, and the rest of the points fit a smooth curve. That’s not the only possibility. It’s conceivable that support for National really shot up by 10 percentage points and then back down again, though such a dramatic change doesn’t seem likely. It’s also possible that the new poll is the outlier and that support for National is up to nearly 40%, or that both polls are ‘rogue’ and the truth is in the middle. It will be easier to be sure when we have results from another poll, which should happen soon.
There’s a general problem that opinion polls are getting less informative in New Zealand. There are fewer polls being published, and by fewer pollsters. Response rates are probably also going down, as is happening generally with phone surveys around the world. It’s also possible that the whole sampling and bias correction infrastructure is being affected by Covid-related changes in working from home, and that all the polls are less accurate this year.
As always, it’s important to take the opinion polls in context, and not to over-interpret individual ones. The polls are a fairly crude assessment of popular support for National or Labour or NZ First or the Greens, but they’re still going to be more representative than going by what your mates reckon – and that’s a big part of their social value.