

We hear a lot about the gender gap in wages, but what about other kinds of demographic disparities? Taking the median yearly wage of a Pacific Island woman as a baseline, Chris McDowall plots out a year in New Zealand salaries.
On November 14, Hilary Barry tweeted, “Dear Women of NZ, I’ve got some bad news for you. From today until the end of the year you’re working for free. #GenderPayGap”. This message was widely shared on social media and accompanied an interview with Barry in the NZ Herald and a narrated infographic on TVNZ’s Breakfast.
Dear Women of NZ, I’ve got some bad news for you. From today until the end of the year you’re working for free. #GenderPayGap
— Hilary Barry (@Hilary_Barry) November 13, 2017
Men and women are not paid equally. In an analysis of New Zealand wage and productivity data, researchers at Motu Economic and Public Policy Research found women overrepresented in low-paying jobs. Yet this difference only explains part of the wage discrepancy. Women also receive less pay for making the same level of contribution.
“When comparing men and women in the same industry, we found they were statistically indistinguishable in how much value they added to their firms. Yet, for work of the same value the average woman in the private for-profit sector was paid only 84 cents for every $1 paid to the average man.”
The Council of Trade Union’s Countdown Clock has proved an effective tool for communicating these ideas. It boils economic statistics down to a single calendar date with a clear message: From this day, the average woman works for free. Explaining difference through the metaphor of a calendar offers both an intuitive sense of scale and a day to rally around.
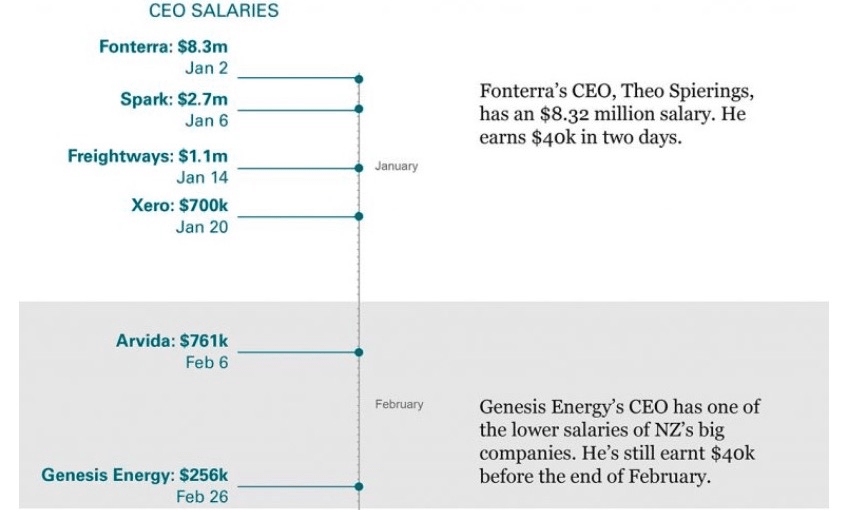
The gender pay gap event got me wondering. What about ethnicity? What about different types of occupation? What about CEOs? How do other demographic groups compare?
To wrap my head around these things, I collected data points and started plotting them on a timeline. I wanted to see a big calendar comparing everything at once.
The median annual income for a Pacific Island woman in full-time work is $39,878. Let’s use that as a base. How long does it take different people to earn that amount?
With a salary package of $8.32m, the CEO of Fonterra earns $40k in two days. Other chief executives are not far behind. At the other end of the scale, the average kitchen worker or retail assistant takes one year and three months to earn the same amount.
These contrasts help me understand the scale of inequality. When I read these numbers in a news story, or hear them spoken on the radio, I recognise that one is big and other is small. Seeing them separated by a chasm of months helps me appreciate the true magnitude of difference.
Notes on data sources follow the timeline.

Notes
The Fonterra CEO salary comes from a series of reports on Theo Spierings’s salary package.
The remaining CEO salaries are a sample from the Business Herald’s annual CEO pay survey.
The Trade Me salary guide details the median pay for full-time roles listed on Trade Me Jobs between October 2016 and March 2017. The pay rates do not include overtime or other bonuses.
Median 2017 earnings for demographic groups is derived from data extracted from StatsNZ’s Earnings from wage and salary jobs by sex, age groups, ethnic groups, and full-time and part-time status table. A copy of the extracted data is available on this Github gist page.
The D3.js code used to create the visualisation is available here.
The Society section is sponsored by AUT. As a contemporary university, we’re focused on providing exceptional learning experiences, developing impactful research and forging strong industry partnerships. Start your university journey with us today.