

The latest in our series of charts, graphics and data visualisations by Chris McDowall. David Garcia also helped create today’s charts.
This work is entirely funded by the generosity of The Spinoff Members
These posts collate the most recent statistics and present them as charts and maps. The Ministry of Health typically publishes data updates in the early afternoon, which describe the situation at 9am on the day of release. These data visualisations are interactive – use your mouse or thumb to hover over each graph for more detail.
Note for users of The Spinoff app: if the charts below are not appearing, please update your app to the latest version.
This afternoon’s Ministry of Health figures report that the total number of confirmed and probable Covid-19 cases stands at 1,330 (1,049 confirmed and 281 probable). A total of 422 people have recovered, an increase of 49 since yesterday.
There were 14 new confirmed cases reported in the last 24 hours and four new probable cases. The number of significant clusters with 10 or more cases is unchanged at 13.
There are 14 people in hospital. That includes five in intensive care units – one each in Wellington, Middlemore, Wairau in Blenheim, Dunedin and North Shore hospitals. The Dunedin patient is in critical condition. No further deaths have been reported.
Yesterday, 2,421 tests were processed. This was a significantly smaller testing volume than in recent days. The ministry reported averaging 3,523 Covid-19 lab tests per day during the week ending April 11. A total of 61,167 lab tests have been conducted since January 22. There are 66,712 test supplies in stock.
This chart compares active and recovered cases. Active cases are confirmed or probable cases of Covid-19 where the person has neither recovered nor died. Recovered cases are people who were once an active case, but are at least 10 days since onset and have not exhibited any symptoms for 48 hours.
Once again there was a slight decrease in the number of active cases – from 886 active cases yesterday down to 855 this morning. Aside from a slight uptick on Wednesday, the active cases total has trended slowly downwards for the last week.
A few people have got in touch asking for clarification on probable cases and whether they should be counted as active. Core to my decision to include them together is the statement by Ashley Bloomfield’s, the director general of health, on probable cases at the April 7 media briefing.
“This is a person who has returned a negative laboratory test result but the clinician looking after the person has diagnosed them as a probable case due to their exposure history and their clinical symptoms. These cases are actually treated as if they were a positive laboratory confirmed case and the actions taken are the same as for a confirmed case.”
Given that probable cases are “treated as if they were a positive laboratory confirmed case and the actions taken are the same as for a confirmed case” I think it is most appropriate to include them in the active classification. A person who is a probable case can become a recovered case or even, sadly, among the count of people who have died..
An alternative title for this chart might be: Cases the ministry of health treated as active by day, irrespective of lab test result.
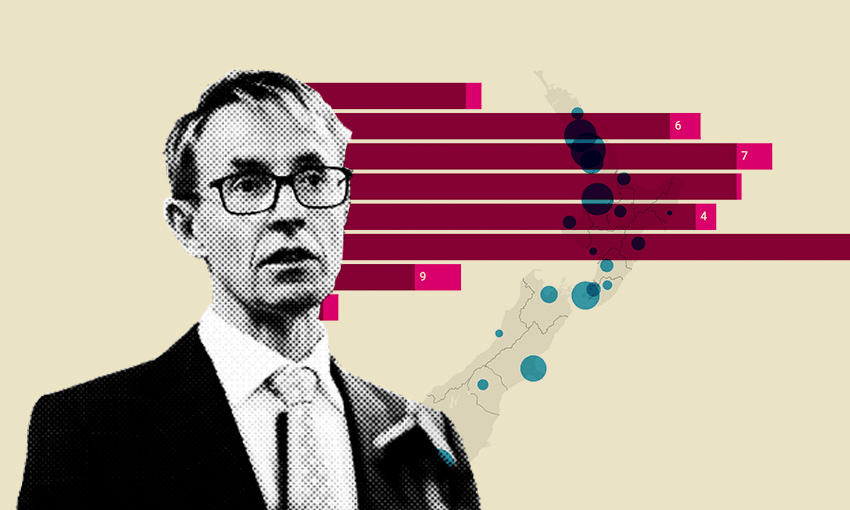
The symbol map shows confirmed and probable Covid-19 cases arranged by district health board. Southern (206), Waitematā (192), Waikato (176) and Auckland (175) remain the four district health boards with the largest number of active cases. Waikato recorded the largest increase, from 167 to 175 cases.
This chart shows confirmed and probable cases by their date of report. It shows cases according to their “date of report” rather than the “date the case was classified as confirmed/probable”. This is a subtle but important distinction.
The number of cases reported on a particular date may not match the number of cases reported in the last 24 hours. This is because the number of confirmed and probable cases reported in the last 24 hours includes cases which were entered on an earlier date as “under investigation” or “suspected” whose status has now been changed to confirmed or probable.
The final chart is the age profile breakdown. I haven’t included this for a few days, because it’s shape was hardly changing. There has been a slow growth of older age groups in recent days, especially in places like Christchurch. I intend do dig into this over the next day or two.