

The latest in our series of Covid-19 charts, graphics and data visualisations. David Garcia created today’s charts.
This work is entirely funded by the generosity of The Spinoff Members
These posts collate the most recent statistics and present them as charts and maps. The Ministry of Health typically publishes data updates in the early afternoon, which describe the situation at 9am on the day of release. These data visualisations are interactive – use your mouse or thumb to hover over each graph for more detail.
Note for users of The Spinoff app: if the charts below are not appearing, please update your app to the latest version.
This afternoon’s Ministry of Health figures report that the total number of confirmed and probable Covid-19 cases stands at 1,445 (1,107 confirmed and 338 probable). A total of 1,006 people have recovered, an increase of 32 since yesterday. There were two new confirmed cases reported in the last 24 hours and three new probable cases.
There has been one new death, a woman in her 70s who was one of six residents from St Margaret’s care home in Auckland’s Te Atatū who had been transferred to hospital.
The number of significant clusters with 10 or more cases remains at 16. There are 12 people in hospital, which is two fewer than yesterday. Three are in intensive care units, with one each in Middlemore, North Shore and Dunedin hospitals. None are in a critical condition.
Yesterday, 3,203 tests were processed. The ministry reported averaging 3,587 Covid-19 lab tests per day during the week ending April 20. A total of 89,508 lab tests have been conducted since January 22. There are 83,001 test supplies in stock, down from 88,535 yesterday.
This chart compares active and recovered cases. Active cases are confirmed or probable cases of Covid-19 where the person has neither recovered nor died. Recovered cases are people who were once an active case, but are at least 10 days since onset and have not exhibited any symptoms for 48 hours.
For the fifth day, Ministry of Health statistics show more recovered than active cases. The number of active cases dropped again, from 454 to 426 this morning. The overall downward trend of active case counts that started around April 8 continues.
The symbol map shows confirmed and probable Covid-19 cases arranged by district health board. In keeping with the relatively small number of new cases, there is minimal change in regional counts. Southern (no change 216), Waitematā (no change 212), Auckland (up one to 186) and Waikato (185 no change) remain the four district health boards with the largest number of active cases. Capital & Coast recorded the largest increase, with an increase in two cases overnight bringing the total to 95.
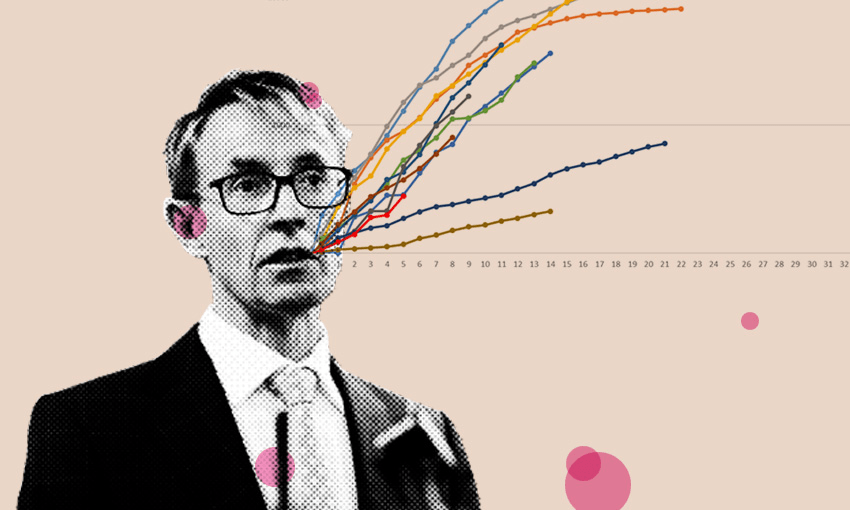
There are 16 significant clusters under investigation by the Ministry of Health, the same as yesterday. The Bluff wedding cluster grew by two cases to 98, and the Rosewood rest home cluster grew by two cases to 43.
This chart shows cases by the date they were first entered into EpiSurv, ESR’s public health surveillance system. Note that the number of cases reported on a particular date may not match the number of cases reported in the last 24 hours. This is because the number of confirmed and probable cases reported in the last 24 hours includes cases that were entered on an earlier date as “under investigation” or “suspected” whose status has now been changed to confirmed or probable.
The same broad trend that we see in the other charts is evident here. There is a downward trend in the number of cases.