
The latest in our series of charts, graphics and data visualisations by Chris McDowall. David Garcia worked with Chris to create today’s charts.
This work is entirely funded by the generosity of The Spinoff Members, with support from the Science Media Centre.
These posts collate the most recent statistics and present them as charts and maps. The Ministry of Health typically publishes data updates in the early afternoon, which describe the situation at 9am on the day of release. These data visualisations are interactive so use your mouse or thumb to hover over each graph for more detail.
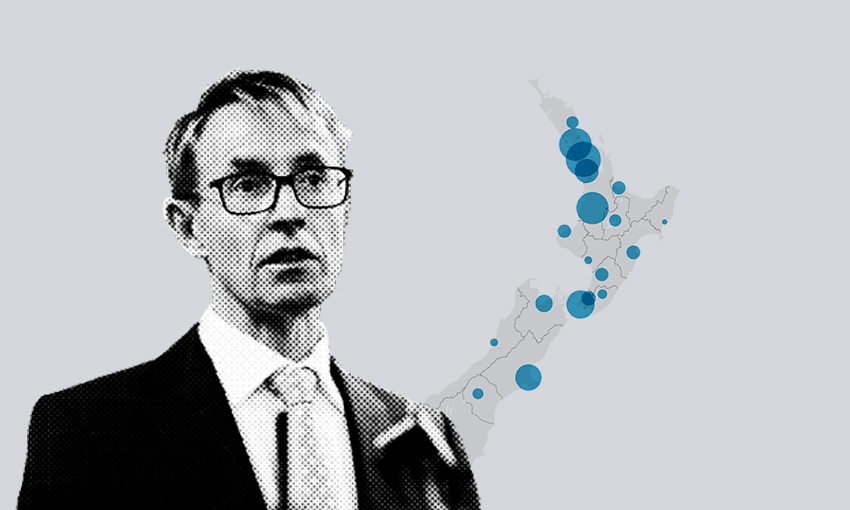
Early this morning New Zealand moved to Covid-19 alert level three. Writing such sentences still feels like science fiction, even after a month of compiling these daily posts. New cases continue to trickle in. As Ashley Bloomfield, director of health, made clear in today’s media briefing, we are not out of the woods yet.
“Elimination is not a point in time. It is a sustained effort to keep it out and stamp it out over many months. It is crucial that all New Zealanders remain vigilant.”
This afternoon’s Ministry of Health figures report that the total number of confirmed and probable Covid-19 cases increased by three to 1,472 (1,124 confirmed and 348 probable). A total of 1,214 people have recovered, an increase of 34 since yesterday. There were no further deaths overnight.
The number of significant clusters with 10 or more cases remains at 16. There are nine people in hospital, which is an increase of two since yesterday. One of these people is in Middlemore’s intensive care unit.
Yesterday, 2,146 tests were processed. The ministry reported averaging 5,223 Covid-19 lab tests per day during the week ending April 27. A total of 126,066 lab tests have been conducted since January 22. There are 66,322 test supplies in stock, down from 69,258 yesterday.
This chart compares active and recovered cases. Active cases are confirmed or probable cases of Covid-19 where the person has neither recovered nor died. Recovered cases are people who were once an active case, but are at least 10 days since onset and have not exhibited any symptoms for 48 hours.
The overall downward trend of active case counts that started around April 8 continues. Note how the blue curve is levelling off, while the purple bars continue to decline. This means there are very few new cases being reported while existing cases steadily recover.
The symbol map shows confirmed and probable Covid-19 cases arranged by district health board. In keeping with the relatively small number of new cases, there is minimal change in regional counts. Waitematā (up one to 223), Southern (no change at 216), Waikato (no change 186) and Auckland (down two to 173) remain the four district health boards with the largest number of active cases.
A review of the total cases by DHB table on the ministry’s website suggests, given the net increase of three cases overnight, the Auckland cases were reclassified to another DHB rather than downgraded.
There are 16 significant clusters under investigation by the Ministry of Health. The ministry has not released formal counts associating deceased persons with clusters. Instead, we compiled these numbers from ministry media releases about each case.
In most clusters the number of recovered cases outweighs the number of active cases. Three clusters buck this trend. Both Auckland residential care facilities and the Rosewood aged care cluster in Christchurch all have more active than recovered cases.