


The Financial Markets Authority has launched an interactive tool that let’s you access, and compare, basic fund information. Rebecca Stevenson extracts herself from KiwiSaver ennui to take a look at the numbers.
I have a confession. I have a KiwiSaver, and yet for the first two years or so I didn’t realise I had it. Yes, I am one of those people. I am rather hopeless with money, which is likely why my former employer stuck me in a default KiwiSaver back in the day without asking me first. I know 3% of your salary seems a lot, but when you have the ability to fritter away money like I do – well, it was definitely a blessing and I didn’t miss it. Nothing good happens after 2am anyway.
After a short stint in the ANZ default fund (the best thing about this fund was that I was with ANZ at the time, so I could see my balance whenever I logged in), for some reason a few years ago I had a rush of blood to the head and decided to change my KiwiSaver to something a little more exciting. But not too exciting, mind. I want money in that account at all costs.
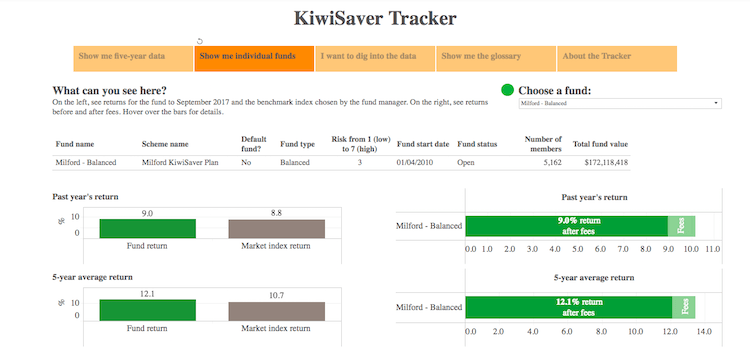
So I enrolled with Milford Balanced Fund. The word on the street back then around Wellington was that Milford was the fund to be with. They may have gotten into a spot of bother a few years ago, but I’ve been pretty happy with the fund.
My KiwiSaver now has about $14,000 in it. I have been pretty patchy at depositing money; a natural consequence of taking off on maternity leave and not earning regularly. But when I have been working I always make sure I put in the minimum amount – $1042.86 – to gain the member tax credit of $521.43 (free money from the government people). The member tax credit used to be basically dollar for dollar. Up until 2011, if you put in $1042.86 you got $1042.86. So I made sure I did that, and my account was looking pretty tasty quite quickly!
I’ve been considering changing again, but I am really not that motivated to do anything about it. But the Financial Market’s Authority has launched a handy wee tool (browser alert: this is best on desktop or laptop, OK on tablet, not mobile) that allows people to compare some key info about KiwiSaver funds. You can see what return your fund has made for the past year, and if it’s been operating long enough, for the past five years. But the really lovely bit of the tool is the ability to see your returns, minus the fees, and how that compares with the other funds.
Now Milford is what’s considered an active managed fund, as in, there are actual people making choices about what the fund invests in. On the other hand you can get index funds, which simply aim to track an index of investments – like the NZX or the ASX for shares – and they require less input from the fund manager, so generally the fees are lower. (Check out FMA’s investor resources.)
So let’s have a look at my award winning fund. Because we all know I haven’t been reading my monthly reviews. The FMA tool shows me that for the past year I have had a return on my $14,000 of 9% after fees. Stretch back five years though and the average return over that period is even better; 12.1%. Whoar! But how much of that return was kept by Milford in fees? Over one year the fees were 1.2%, and 1.4% over five. Look, I can’t complain. But could I do better?
Let’s have a look at some other funds. I’m looking at how well they did in their returns but also how much of that I would have kept rather than paying it out in fees. Maybe I should go for more growth? If I went back to an AMP ANZ Growth Fund my returns for the past year would have been 10.7% after fees of 1.3%. Not much impetus, at least on fees and returns, to move with that one.
What about a straight ANZ Growth KiwiSaver? The returns are slightly up, but not as much as you might think considering I am in a Milford Balanced Fund, and we are comparing with the growth fund that is aiming for higher risk and higher return investments. You can also see how risky your fund is with a “risk indicator” rating of 1 being lowest risk and 7 being the highest. This fund has averaged returns of 12.7%, after fees of 1.1% over the past five years.
Let’s look at a Fisher Funds TWO Growth KiwiSaver. Again, over five years, the return is 10.3% with fees of $1.2% – again all of these fees exclude fixed membership fees.
What about the returns for new kid on the block Simplicity? Simplicity is a non-profit low-fee KiwiSaver. It has only been running for a short time, so there’s no five-year data, but for the past year someone in a Simplicity balanced fund would have earned 8.3%, but the fees are where you really see the difference at 0.3%. The Simplicity growth fund delivered 13.3% returns before fees, and as they charge the same fee across all their funds – 0.3% – the after fee return is 13% for 12 months. Not bad at all.
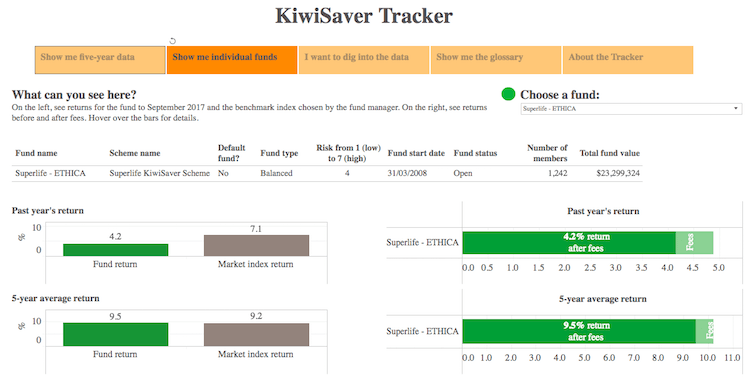
The fund I have most been considering switching to because there is a giant billboard near my house is Superlife. How do they compare with Milford? I’m feeling pious so let’s look at its Ethica fund, which “is a balanced investment fund that invests on a socially responsible basis, by excluding investments that do not meet defined principles”. So it’s not likely investing in cluster bombs. Phew! For the past year it has had returns of 4.2% (yikes) on fees of 0.7% And over five years it is 9.5% after fees. Not bad at all.
Helpfully, all of the funds are also compared on screen to the market index for that fund; this basically allows you to compare your fund with how similar investments have performed in the market. This helps you check if the manager is achieving what it says it’s aiming for. The tracker also lets you review and arrange the funds by their risk profile – conservative, balanced, growth and so on, so that you’re comparing apples with apples.
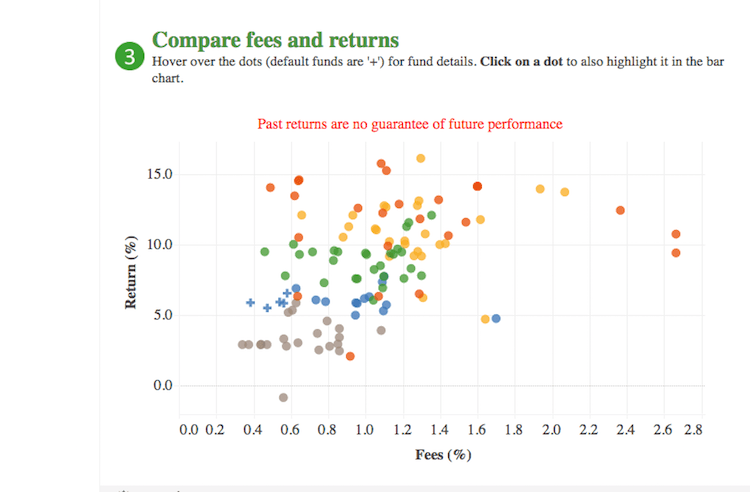
Now there is a bunch of other information available on the tracker. You can look at a scatter plot and at a glance see if your fund is an outlier for any reason. Now this is pretty cool, because I can see straight away my fund is the best performing balanced fund in terms of returns (yay!). I probably could have done better in a growth fund – the scatter plot throws up the best performing fund after fees as the never-heard-of-it Quay Street New Zealand Equity growth fund. Its 148 members have received average returns over five years, after fees, of 16.2%! But, this fund is a riskier fund than mine, rated 4 compared to the balanced fund at 3.
So what am I going to do? Milford is an annoyingly consistent performer, so probably nothing. But how fun has this been? The beauty of the tracker is it’s all really easy and in your face, it’s a great place to start looking more closely at your fund.
But it works alongside the comprehensive, and independent comparison sites such as Sorted’s fund finder which gives you detail, like the level of service each provider gives to its members. And of course the information you get from your provider needs to be in the mix too. The important thing is to start thinking about your KiwiSaver a little more often than never, and to check how much you will have for your retirement. We’ve always had universal superannuation, but there is no guarantee it will be there for us when we finally stop toiling at work so your KiwiSaver will be critical. Check out the tracker here.
This content is brought to you by the Financial Markets Authority.
The FMA’s raw KiwiSaver data is available here. The Tracker has been designed to enable users to embed it within their own website. Just look for the ‘share’ icon and follow instructions (you might need to create an account and login, but it’s free).